Economy
EUR/JPY, AUD/JPY Levels to Watch

Japanese Yen Outlook, AUD/JPY, EUR/JPY, JPY Technical Analysis – Talking Points:
- Japanese Yen may extend its recent decline after snapping key trend support and sliding into oversold territory for the second time in 2020.
- EUR/JPY rates due for a pullback as RSI divergence suggests exhaustion and price carves out a bearish Rising Wedge pattern.
- AUD/JPY tracking in Ascending Triangle hints at possible bullish breakout in the coming days.
Despite a relatively bleak fundamental backdrop, the haven-associated Japanese Yen seems poised to extend its 5-month decline against its major counterparts after snapping its 6-year uptrend and sliding into oversold territory for the second time this year.
Japanese Yen Index** Daily Chart
JPY Index daily chart created using TradingView**JPY Index averages CAD/JPY, EUR/JPY, AUD/JPY, GBP/JPY
Directed lower by the downtrend extending from the yearly high set in March, JPY crashed through its 2014 uptrend earlier this month before finding support at the February low.
Although RSI divergence suggests a degree of underlying exhaustion in the recent downtrend, the oscillator continues to track below 30 and in oversold territory. This could be indicative of further losses in the near-term for the Japanese Yen.
However, with the February low capping the downside for the time-being a corrective rally to test the March downtrend may be likely in the coming days.
The development of the trend-defining 50-day moving average also hints at a potential correction, as it notably flattens out after crossing below its ‘slower’ 200-period counterpart.
Nevertheless, the path of least resistance for the ‘safe haven’ currency appears to be lower, with a break and close below the February lows needed to validate bearish potential.


Recommended by Daniel Moss
Get Your Free JPY Forecast
EUR/JPY Daily Chart – Rising Wedge Pattern Threatens Uptrend
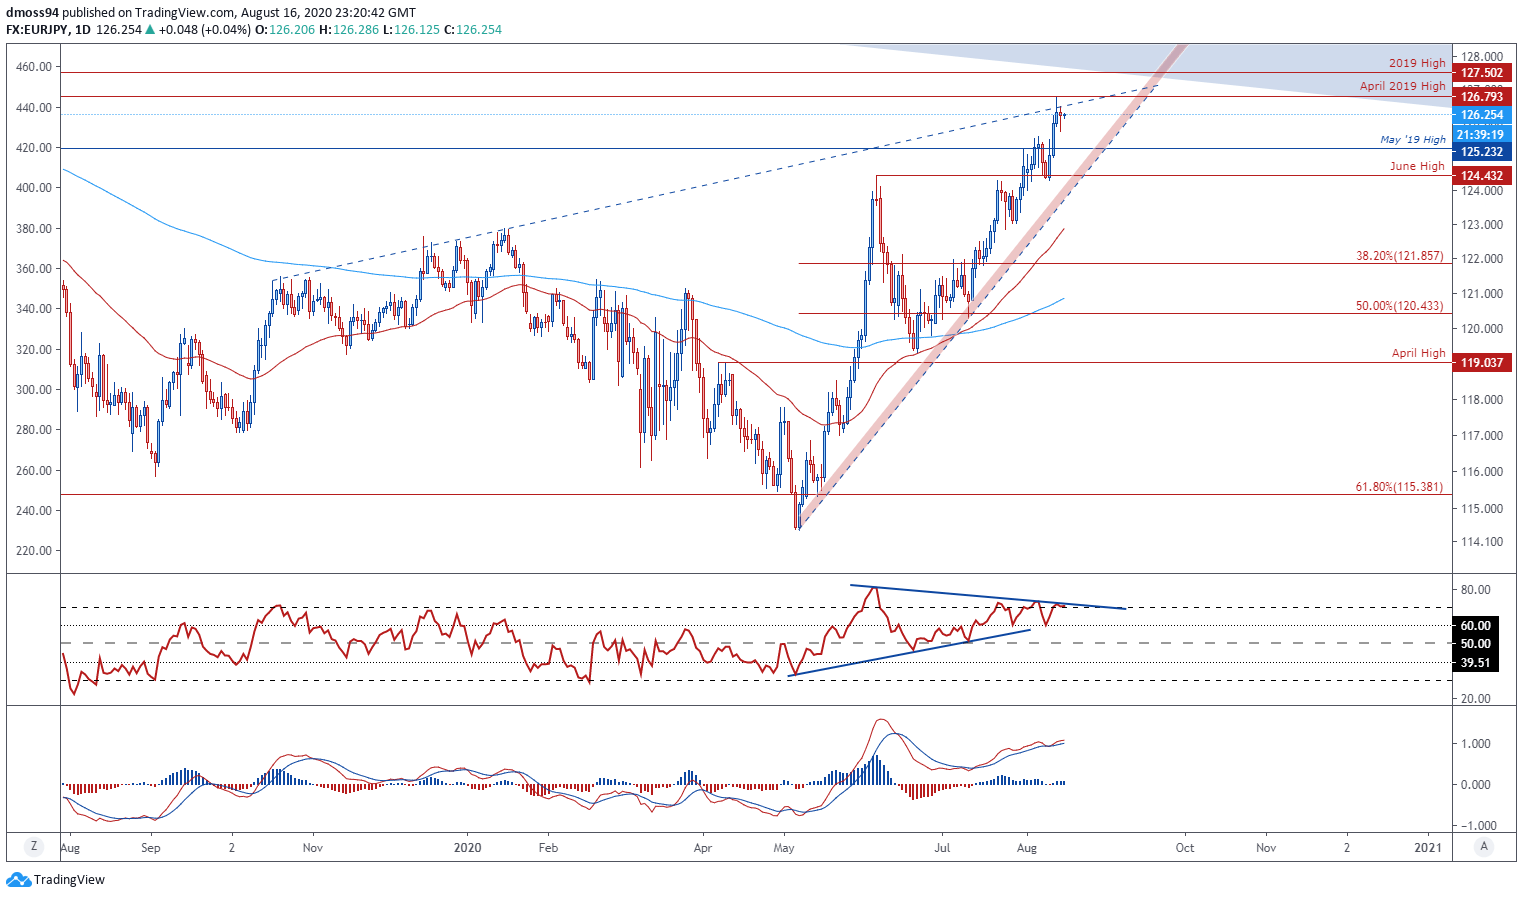
EUR/JPY daily chart created using TradingView
A Hanging Man candle just shy of the April 2019 high (126.80), combined with significant RSI divergence, could signal the end of the EUR/JPY exchange rate’s 10.8% surge from the May low (114.39) to set a fresh yearly high on August 13 (126.75).
With price appearing to have carved out a bearish Rising Wedge pattern over the last 12 months, a substantial break to the downside could be in the offing if sellers can snap the exchange rate’s 14-week uptrend as well as support at the June high (124.43).
That being said, the positive steepening of the 50- (122.85) and 200-DMA (120.88) suggests an overall shift in sentiment from bearish to bullish and could see any pullback in EUR/JPY rates significantly supported by an influx of buyers.
Therefore, although price seems poised to slide back to support at the May 2019 high (125.23), extended declines may not eventuate should key psychological support at the 125 level remain intact.
A decline may allow EUR/JPY to shake off overbought readings on the RSI and regroup for a push to fresh yearly highs, if buyers can smash through resistance at the monthly swing top (126.75).
| Change in | Longs | Shorts | OI |
| Daily | 17% | 5% | 10% |
| Weekly | 32% | 16% | 22% |
AUD/JPY Daily Chart – Triple Top or Ascending Triangle?
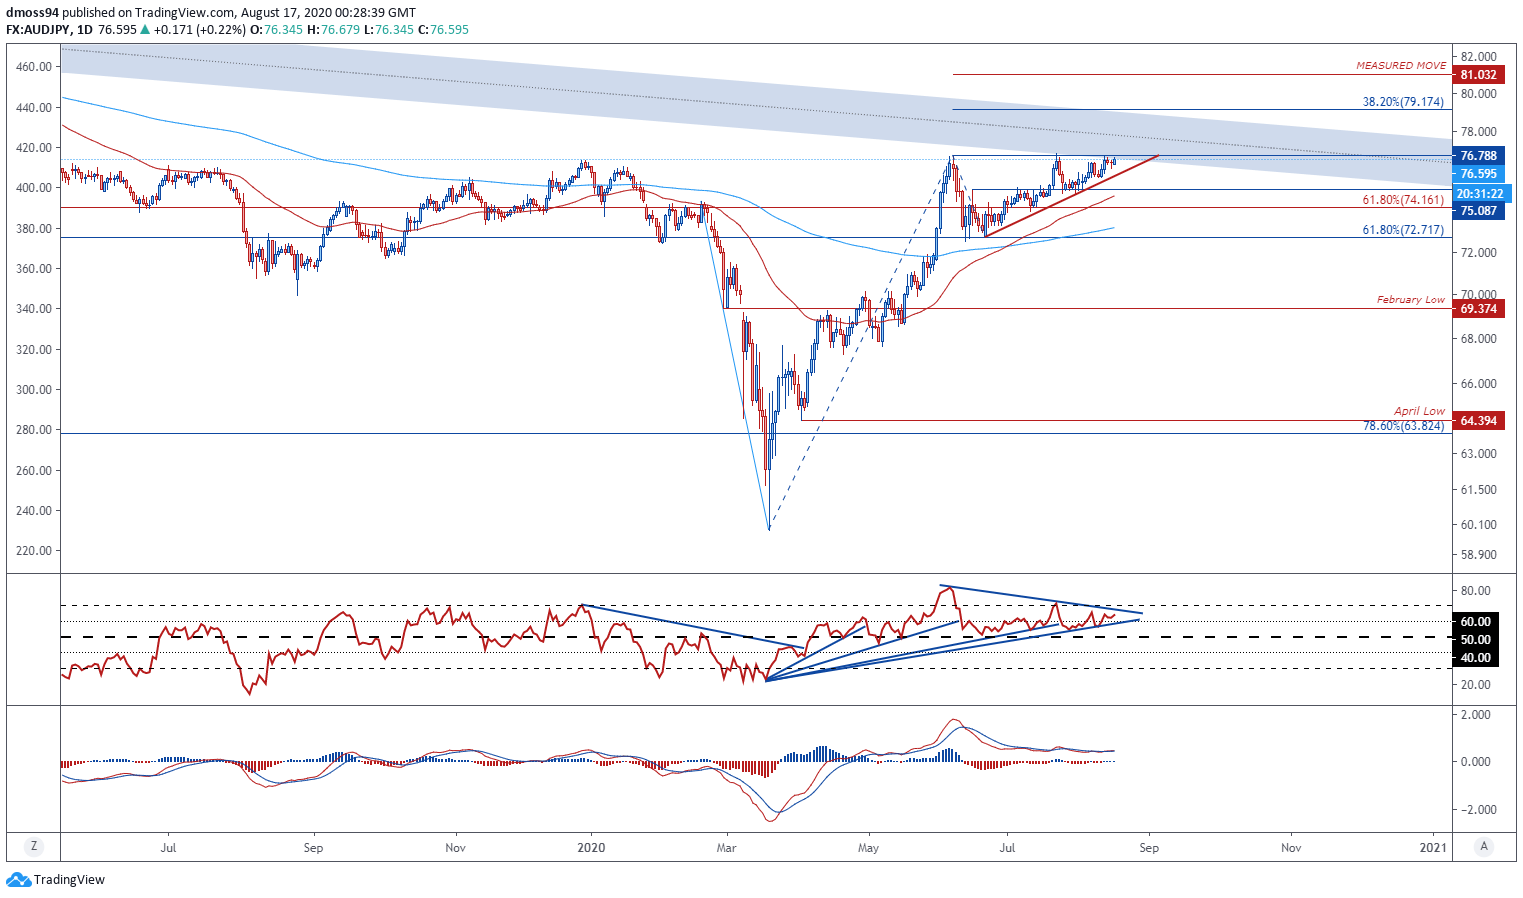
AUD/JPY daily chart created using TradingView
AUD/JPY rates appear to have carved an Ascending Triangle pattern at key resistance, with a series of lower lows and stagnant highs signalling that sellers may be running out of steam as they attempt to defend the psychologically pivotal 77 level.
Moreover, the RSI looks to be gearing up for a push into overbought territory as it hovers in bullish territory above 60 and could stoke buying pressure if it breaks above its downtrend extending from yearly extremes.
Overbought readings would probably coincide with AUD/JPY climbing above key resistance at the June high (76.78) and potentially validate a topside break of the bullish Ascending Triangle continuation pattern.
An implied measured move suggests price could push to test the 81 level for the first time since April 2019.
Conversely, a break of trend support would invalidate the bullish pattern and could ignite a pullback to the 200-day moving average (73.15) and 61.8% Fibonacci (72.72).
| Change in | Longs | Shorts | OI |
| Daily | 0% | 13% | 8% |
| Weekly | 6% | 12% | 10% |
— Written by Daniel Moss, Analyst for DailyFX
Follow me on Twitter @DanielGMoss

Recommended by Daniel Moss
Building Confidence in Trading


“Internet specialist. Evil entrepreneur. Troublemaker. Analyst. Tv aficionado. Thinker. Passionate explorer. Bacon guru.”